stewardship governance metrics
Many excellent frameworks already measure progress beyond GDP. Our metrics give them a nested home: they bring existing indicators together under one shared logic and anchor them in law. Evaluating them jointly lets every partner benefit from deeper insight and shared data.
the zero-baseline principle
Stewardship is not about reaching an artificial high score.
It is about maintaining a state of trust, balance and responsibility.
Zero marks that state: clear, stable and immediately actionable.
Most frameworks start at zero and reward points on the way to “gold” or “platinum”. Stewardship works the other way round. Zero is the standard of full stewardship. Every shortfall will mean that any deviation is recorded as a stewardship gap.
There are three reasons for this:
- Loss aversion. Research in behavioral economics shows that people are roughly twice as motivated to close a deficit as to achieve an equal gain. Seeing an open gap on a dashboard creates constructive urgency.
- Duty, not bonus. Protecting public trust, resources and safety is a core responsibility. Points for basic governance would suggest it is optional.
- A stable anchor. In point systems the “perfect score” keeps shifting as criteria expand. A zero-state remains comparable over the years.
| Dimension | Zero-baseline model | Accumulation model |
|---|---|---|
| Meaning of “0” | Full stewardship is achieved. | Starting point from which to prove worth. |
| Drive | Gaps demand action to return to zero. | “Good enough” scores invite complacency. |
| Focus | Closing specific gaps in the system. | Collecting easy points. |
| Comparability | High: the standard stays constant. | Low: the maximum changes over time. |
a language of balance
The model is meant to invite collaboration, not fear of sanctions. We therefore use constructive terms:
- 0 is the state of balance.
- A shortfall is a stewardship gap, not a failure. Gaps are named by urgency – minor, significant, critical.
- Action items are pathways to alignment: the concrete steps that bring a metric back to zero.
A metric thus becomes a roadmap rather than a grade. Every gap comes with the action that closes it.
weighting
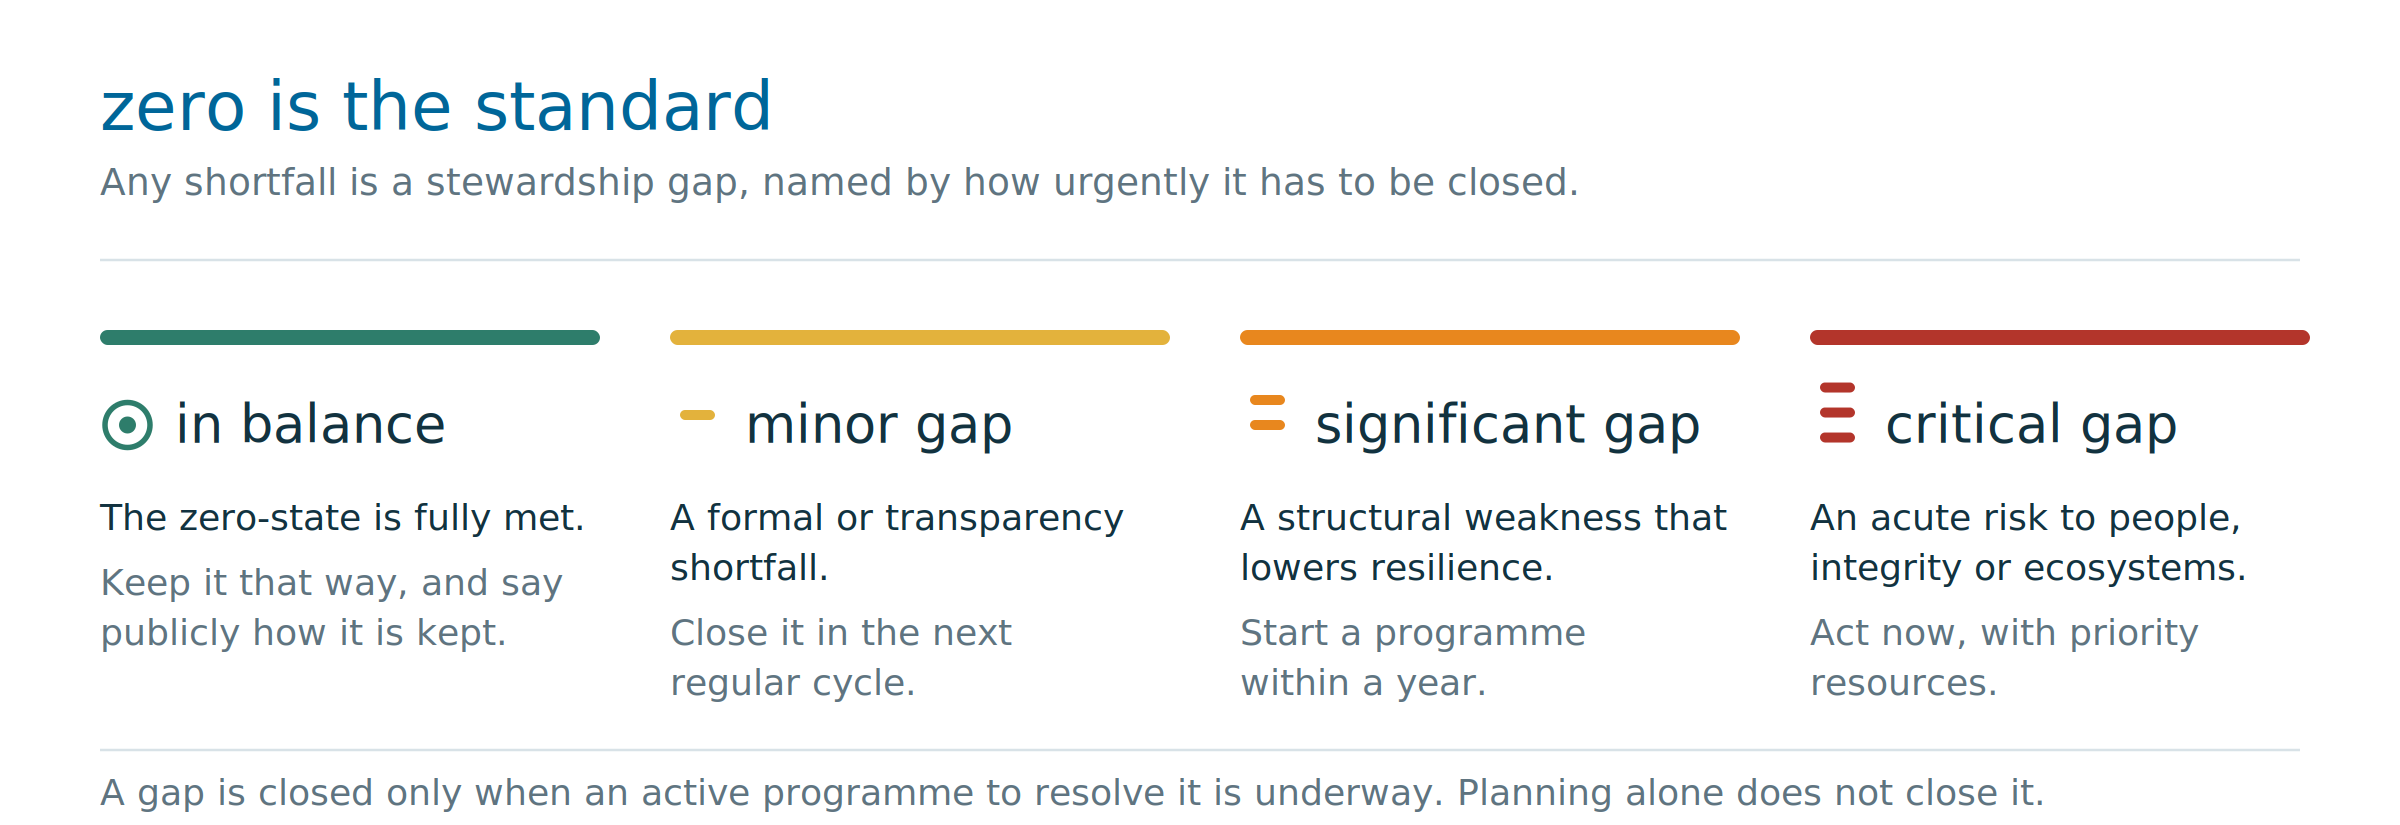
To avoid bureaucratic overload, we use three levels, based on the urgency of action:
- minor gap: a formal or transparency shortfall. It does not disrupt operations but weakens trust over time, as with a delayed annual report.
- significant gap: a structural weakness that needs planned action, as with undefined roles in crisis management.
- critical gap: an acute risk to people, integrity or ecosystems. It requires immediate action and priority resources, as with missing emergency protocols for a known hazard.
Where the framework is applied to something that has to be priced rather than just prioritised, the same gaps are expressed as positive numerical values that can be added up. Our research on the Public Space & Safety Contribution does exactly that for vehicles and urban street space.
pragmatic realism: action over analysis
Conventional risk assessments often debate probabilities (“15% or 20%?”) until the risk has been calculated away. Stewardship governance replaces this with one general rule:
A gap is closed only when an active program to resolve it is underway. Planning alone does not close it.
This rule rests on three principles:
- Acknowledge known realities. If a trend is real, we do not wait for the exact when or how much.
- Action defines the baseline. Zero is reached only when an operational program is running.
- No theoretical safe havens. Hazard scores cannot downgrade a gap that has no active solution.
Example: rising sea levels.
The traditional approach spends years modeling millimeters and debating dike heights while little changes on the ground.
The stewardship approach starts from the fact that sea levels are rising. A gap exists until an adaptation program is underway, whether through protection, managed retreat or both, and including support for affected communities. Whether the worst comes in 10, 30 or 50 years, the path to safety begins now.
defining metrics
For each aim, the project groups follow three steps:
- Define the zero-state. What does full stewardship look like?
- Identify the gaps. Which specific, measurable shortfalls weaken it, and at which level (minor, severe, significant)?
- Codify the pathway. Which concrete action closes each gap?
metrics by aim
1 inner presence
Zero-state: Major public decisions follow a documented reflection phase, and public services operate within sustainable workloads.
Builds on: GNH (time use, psychological well-being), OECD Better Life Index (work-life balance)
→ education
2 beautiful community
Zero-state: Everyone has a free, non-commercial meeting place within walking distance and a local support network that responds in a crisis.
Builds on: SAGE (solidarity), OECD Better Life Index (community), GNH (community vitality)
3 co-creative governance
Zero-state: Public decisions are transparent, responsibilities are clearly assigned, people can take part in decisions that affect them, and safety is planned jointly.
Builds on: GNH (good governance), OECD Better Life Index (civic engagement), Economy for the Common Good (municipalities)
→ safety
4 living symbiosis
Zero-state: Every new development achieves a net gain in biodiversity, and water, soil and energy cycles are kept intact.
Builds on: Stanford Natural Capital Project, Happy Planet Index (ecological footprint)
5 equitable prosperity
Zero-state: Everyone has secure access to housing, mobility and basic services, and public budgets report on well-being and ecological impact alongside GDP.
Builds on: UN Beyond GDP, WEGO, National Welfare Index (NWI), SAGE (agency, gain)
building on existing frameworks
Common ground. All of these frameworks agree on four points:
- GDP ignores environmental damage, inequality and well-being.
- Economies must stay within planetary boundaries.
- Social trust, time and civic participation count as much as economic output.
- The well-being of future generations must be explicitly protected.
Key differences.
- Level: Economy for the Common Good works with companies, schools and municipalities. The Natural Capital Project maps ecosystems in space. The others work at national or international level.
- Index or dashboard: The Happy Planet Index and GNH condense everything into a single number. SAGE and the OECD Better Life Index keep separate dimensions, because a strong economy should not hide environmental or social loss.
- Money or direct measures: Germany’s NWI adjusts GDP in monetary terms, correcting for inequality, non-market work and ecological damage. The others measure directly, through surveys or physical data.
| Framework | Level | Method | Focus |
|---|---|---|---|
| UN Beyond GDP | global / national | policy indicator framework | realigning statistics and policy |
| OECD Better Life Index | national | 11-dimension dashboard | quality of life and future resources |
| Economy for the Common Good | organizations, municipalities | matrix, up to 1,000 points, 20 themes | ethical accountability |
| WEGO | national / regional | well-being frameworks and budgets | well-being in public spending |
| Happy Planet Index | global | (well-being × life expectancy) ÷ footprint | ecological efficiency of good lives |
| Stanford Natural Capital Project | ecosystems | biophysical models, GEP | value of ecosystem services |
| Gross National Happiness | national / local | 9 domains, 33 indicators | holistic happiness, good governance |
| SAGE dashboard | national | solidarity, agency, gain, environment | recoupling economy and society |
| National Welfare Index (NWI) | national | monetized index | welfare-adjusted national accounts |
Sources (selection): UN Beyond GDP · UN CEB · OECD Better Life Index · OECD Well-being Data Monitor · Economy for the Common Good · WEGO · Happy Planet Index · Stanford Natural Capital Project · Gross National Happiness · SAGE · NWI